87% of retail CFD accounts lose money with this provider. Your capital may be at risk.
If you’re new to trading or have no experience with reading candles on trading platforms, they can be hard to interpret at first.
This guide covers everything you need to know about candles on IQ Option.

Table of contents
Candlesticks explained
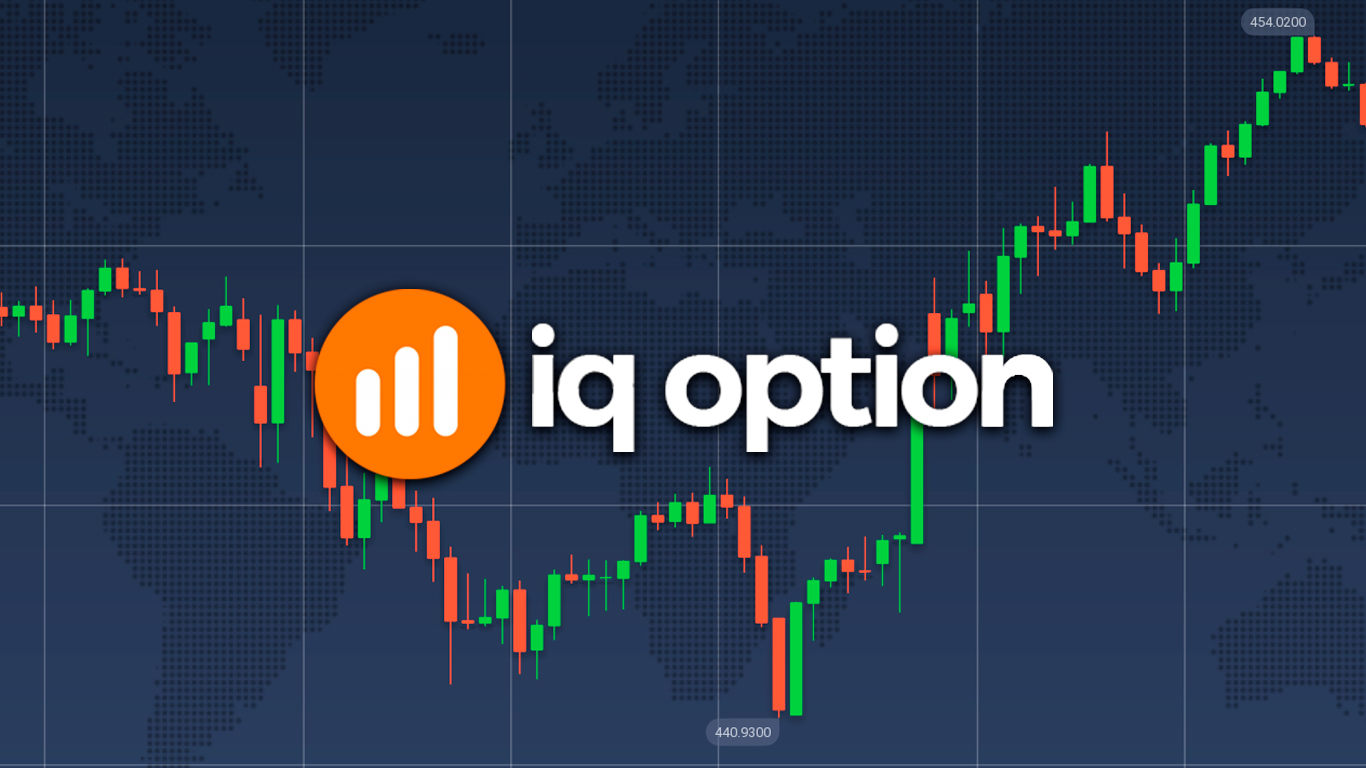
Candlesticks, also known as candles, are an alternative way for trading platforms to present the price movement of assets.
Compared to a simple line, candles showcase more information about the period of time it represents.
Many traders prefer candlesticks over the regular line when trading assets, including forex.
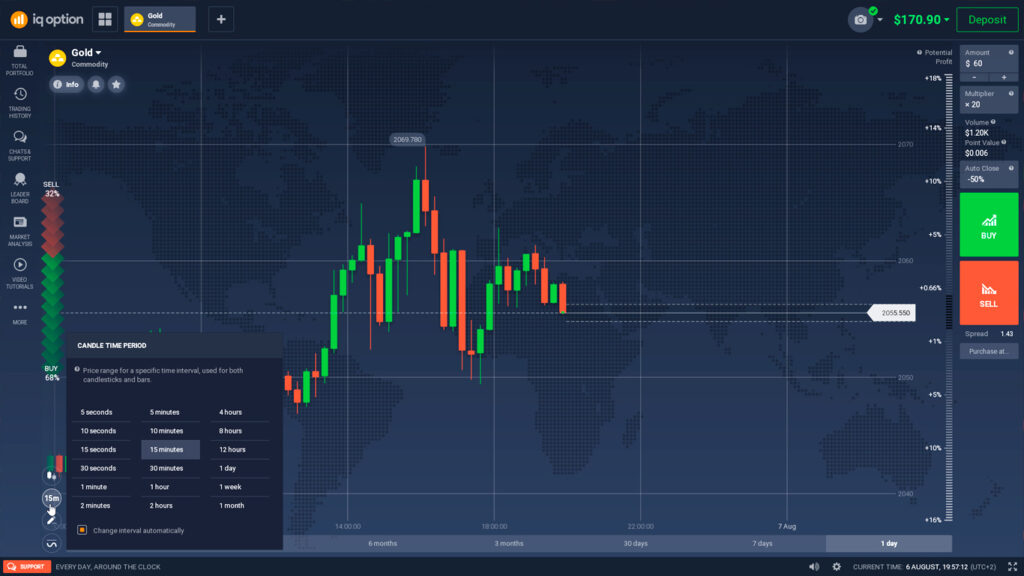
Each candle represents a specific amount of time, which you can see on the left side of the trading window.
You can change the time interval each candle represents by zooming in or out or pressing the icon that shows the current time value and changing it manually.
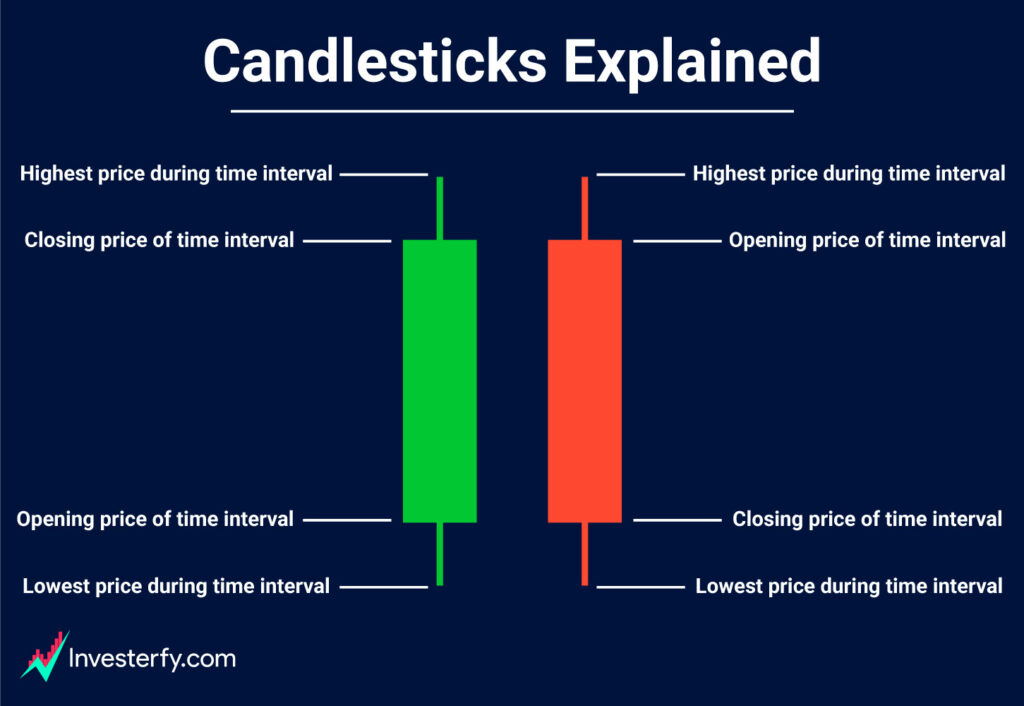
Candles consist of a middle-box and a stick that extends above and below the middle-box.
The middle-box represents the opening and closing price of the selected asset in the given time interval.
If the box is green, the bottom is the opening price, and the top is the closing price.
Likewise, if the box is red, the top is the opening price, and the bottom is the closing price.
The longer the box is, the further the asset’s price has moved within that time interval.
The stick that reaches above and below the middle-box tells you the highest price and the lowest price the selected asset reached in that time interval.
Check out this graphic we’ve made that show you how to interpret candlesticks.
How to switch line graph to candlesticks
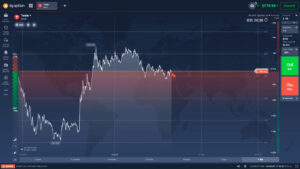
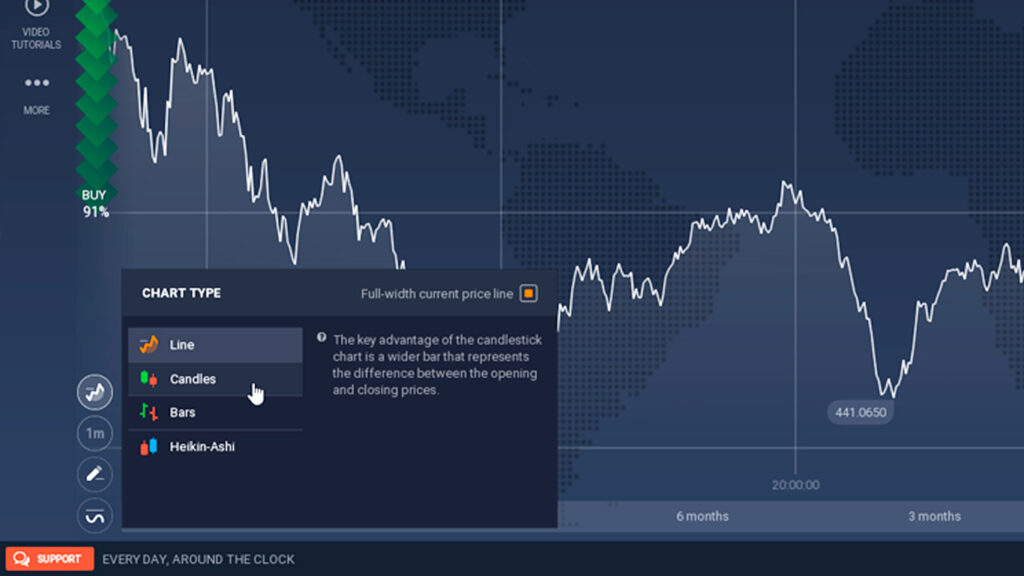
Some accounts display a line graph rather than candlesticks on the IQ Option trading window.
If you want to switch to candles instead of the line graph, press the line graph icon on the left side.
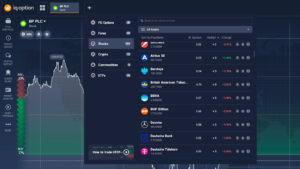
A pop-up window will now appear that allows you to change the design of price graphs.
In this pop-up window, you can select Line, Candles, Bars, and Helkin-Ashi.
Press Candles to switch your current design to the candlesticks graph format.
Disclaimer: Investerfy.com is not a financial advisor. All content on this site is for educational purposes only. Make sure you understand the risk associated with investing and trading.